Introduction
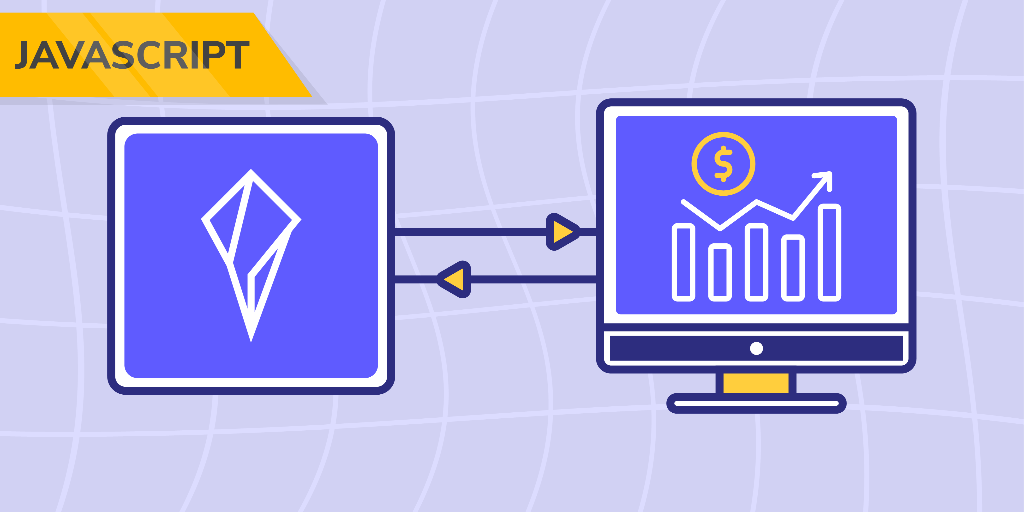
This review covers the free AI-powered course “Get Financial Market Data with Polygon API in JavaScript” and the underlying product,
the Polygon API for Financial Market Data (Polygon.io). The course promises a hands-on path to accessing stocks, forex, and other market data
via Polygon’s JavaScript-friendly endpoints and SDKs. Below I evaluate the course and the API itself: what they do, how they look and feel,
real-world usage scenarios, strengths, weaknesses, and overall value.
Overview
Manufacturer: Polygon (Polygon.io). Product category: financial market data API & developer education course. Intended use: enable developers,
data scientists, traders and hobbyists to query market data (historical and near real-time), retrieve reference data, compute technical indicators,
and integrate market feeds into web applications using JavaScript. The course is positioned as a practical, project-based introduction to these capabilities.
Appearance, Materials, and Design
Because this offering is software + digital training, “appearance” refers to the course interface and Polygon’s developer UX:
-
Course UI / Learning Materials: Clean, modern web pages with well-sectioned lessons. Code samples and interactive notebooks (or embedded sandboxes)
are typically formatted for readability. The AI-powered elements (guided hints or automated code suggestions) are integrated inline where available. -
Documentation & Dashboard: Polygon’s API documentation is polished with navigation for endpoints, examples (curl, JS, Python), and parameter references.
The developer dashboard for API keys and usage metrics is utilitarian and focused on function rather than flashy design—clear graphs and quota displays. -
SDKs and Example Projects: JavaScript examples use idiomatic Node.js/browser patterns. Sample apps provided in the course follow common frontend templates
(React or vanilla JS) and emphasize clarity in UI rather than heavy styling.
Unique design features include example-first docs (real example requests/responses), live playgrounds for trying endpoints, and the course’s combination
of AI assistance with step-by-step project tasks.
Key Features & Specifications
- Data coverage: Stocks, forex, and crypto market data (reference data, aggregates, trades, quotes, tick-level where available).
- Endpoints: REST APIs for historical aggregates, snapshot, tick/trade data, reference metadata; WebSocket streaming for real-time ticks/trades/quotes.
- JavaScript support: Examples, a client SDK (official and community wrappers), sample React/Node projects, and browser/server usage patterns.
- Technical indicators: Endpoints or helper utilities to compute indicators (SMA, EMA, etc.), or sample code to compute them client-side.
- Authentication: API key-based access managed in the developer dashboard.
- Rate limits & tiers: Free tier for experimentation; paid tiers for higher throughput, lower latency, and expanded historical coverage.
- Documentation & learning: Step-by-step course modules, code samples, project walkthroughs, and AI-guided assistance in the course workflow.
- Format: Hands-on, build-a-functional-web-app approach — emphasis on practical outcomes rather than pure theory.
Experience Using the Product
Getting started (beginner-friendly)
Signing up and obtaining an API key is straightforward. The course walks through the initial steps (install SDK or use fetch/axios), and example
requests make it easy to verify connectivity. The AI-guided prompts are useful to quicken onboarding, especially for those who prefer copy/paste learning.
Prerequisites: basic JavaScript/Node knowledge and an account to retrieve an API key.
Building a demo web app (course project)
The course’s project-oriented lessons make building a small market-data dashboard intuitive. Code snippets show how to query aggregate bars for symbol charts,
display recent trades, and pull metadata. The documentation and sandbox examples reduce friction: within a couple of hours you can assemble a working prototype
that displays charts and price feeds.
Prototyping and rapid iteration
For rapid prototyping, Polygon’s REST endpoints and example code are convenient. The developer dashboard and usage metrics help you track whether you are hitting
free-tier limits. The WebSocket feed allows live updates in a development environment, though you should be mindful of rate limits and connection rules.
Production considerations
Moving a project to production requires attention to subscription tier (for throughput and access to premium endpoints), API key security (do not embed keys
in client-side code), backoff and retry logic, and storage/normalization of returned data. The API is robust enough for many production use cases, but for
latency-sensitive or enterprise-grade trading systems you may need paid tiers or dedicated data feeds.
Backtesting and historical analysis
Historical aggregates and tick data give adequate resolution for many backtesting scenarios. However, heavy historical queries can be limited by rate limits
or require a paid plan. The course covers fetching and aggregating historical bars but does not replace a full research platform for large-scale quant work.
Teaching and team onboarding
The structured lessons and clear examples make the course a useful companion when onboarding junior developers or integrating market-data tasks in a curriculum.
The AI-assisted elements help less-experienced users, while more advanced developers will appreciate the endpoint reference and sample apps.
Pros
- Practical, hands-on course that gets you to build a working web app quickly.
- Comprehensive JavaScript examples and SDK support — good for frontend and backend use cases.
- Well-structured documentation with clear request/response examples and live playgrounds.
- Supports multiple asset classes (stocks, forex, crypto) and a mix of REST + WebSocket access.
- Free tier and free course lower the barrier to entry for learning and prototyping.
- Developer dashboard and usage metrics make it easy to monitor consumption.
Cons
- Free tier and course are limited: production use often requires paid plans to lift rate/coverage constraints.
- Some endpoints (e.g., tick-level historical data) can be subject to additional restrictions or higher cost.
- Latency and guaranteed delivery for mission-critical trading systems may not match direct exchange feeds or premium low-latency providers.
- AI assistance in the course helps most common tasks but can occasionally give generic or imprecise suggestions that require developer judgment.
- Security caveat: keys must be protected—accidental client-side exposure can lead to misuse and quota exhaustion.
Conclusion
Overall impression: The Polygon API for Financial Market Data, paired with the “Get Financial Market Data with Polygon API in JavaScript – Free AI-Powered Course,”
is an excellent entry point for developers who want to learn how to integrate financial market data into web applications. The combination of practical lessons,
clear examples, and a polished API surface makes prototyping fast and approachable. For hobbyists, educators, and many application developers, the free tier and
course provide strong value.
If you plan to build production trading systems, large-scale backtests, or low-latency infrastructures, be prepared to evaluate paid plans, observe rate limits,
and consider higher-tier data sources where necessary. For learning, prototyping, or building client-facing dashboards and research tools, Polygon + this course
is a very useful and well-designed option.
Quick Recommendations
- Beginner: Take the free course, follow the project, and use the sandbox to learn endpoints and workflows.
- Developer/Prototyper: Use SDK examples, implement server-side proxies for keys, and monitor quota in the dashboard.
- Production: Evaluate paid tiers, test latency, and implement robust retry/backoff and security practices before going live.
Reviewed product: “Get Financial Market Data with Polygon API in JavaScript – Free AI-Powered Course” (Polygon API for Financial Market Data)

Leave a Reply